
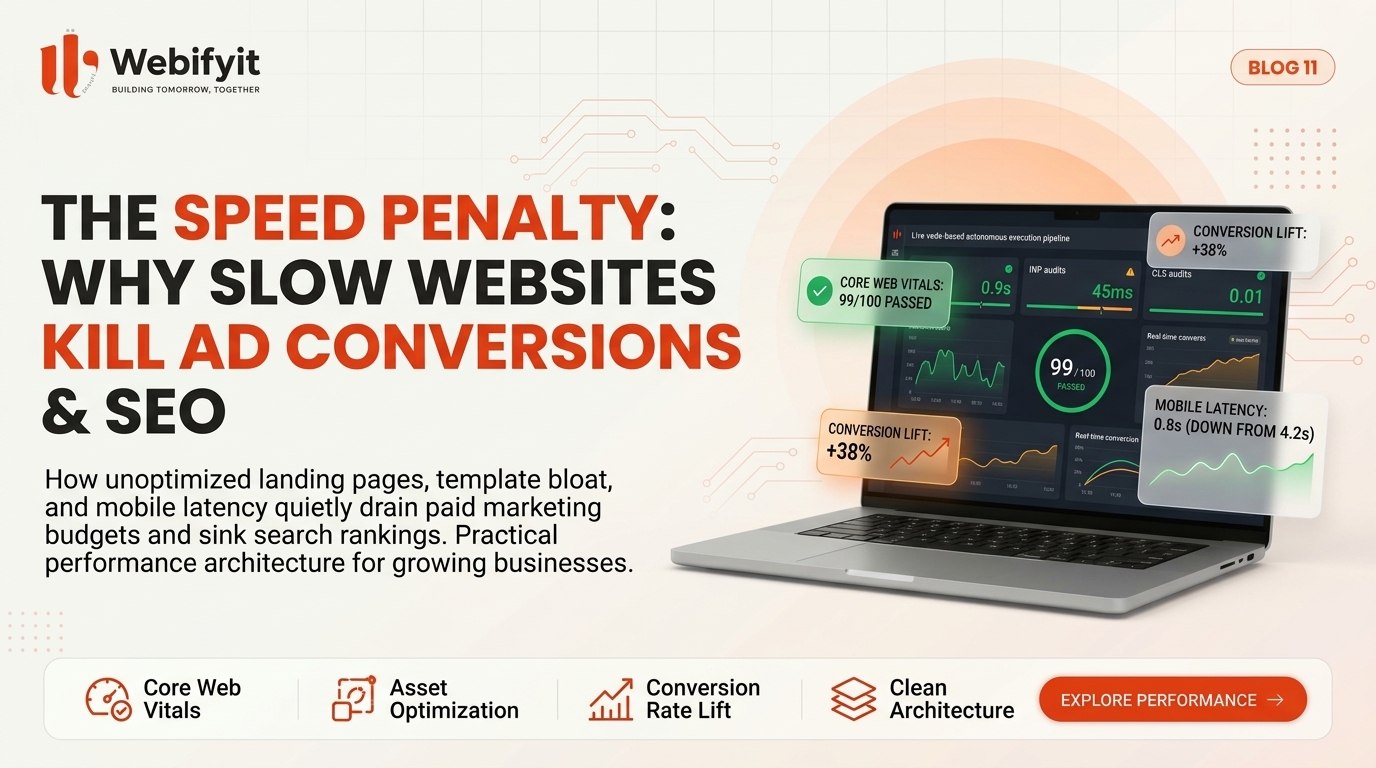
The Speed Penalty: Why Slow Web Pages Quietly Kill Ad Conversions and SEO Rankings
A company launches a paid acquisition campaign on Google Ads and Meta Ads with a monthly budget of $15,000.
The creative team produces compelling ad copy. The targeting parameters reach high-intent prospects searching for B2B software, specialized consulting, or high-ticket retail products. Prospective customers click the links at an average cost of $4.50 per visit.
Yet when marketing leads review the analytics dashboard at the end of the month, the numbers disappoint: cost-per-lead hovers near $180, the landing page conversion rate sits under 1.8 percent, and the bounce rate exceeds 65 percent.
Marketing teams typically respond by swapping ad headlines, testing new color palettes on call-to-action buttons, or blaming the ad platform algorithms.
In most cases, the failure has nothing to do with copywriting or audience targeting. The failure occurs in the four seconds between the ad click and the completed page render.
When a mobile landing page takes four to six seconds to become interactive, more than half of the incoming visitors abandon the tab before the hero section displays. The company paid full price for the ad click, but the visitor never evaluated the offer.
This gap between paid traffic and technical page delivery is the speed penalty. In modern web operations, slow loading times operate as an invisible tax on marketing budgets, search engine rankings, and operational revenue.
The Financial Mechanics: How Milliseconds Drain Paid Media
Performance benchmarks track a direct mathematical relationship between page latency and user bounce rates.
Data collected across millions of mobile sessions reveals that 61 percent of mobile visitors abandon a website if it fails to load within 2.5 seconds. For every additional second of latency past that threshold, conversion rates fall by approximately 14.8 percent.
Consider the financial consequences of running a $10,000 monthly Google Ads campaign across two different technical architectures:
Scenario A: The Bloated Template Site
- Average Cost-Per-Click: $4.00
- Total Ad Clicks: 2,500 visitors
- Mobile Page Load Time: 5.2 seconds
- Immediate Bounce Rate: 68 percent
- Retained Visitors Evaluating the Offer: 800 visitors
- On-Page Conversion Rate: 2.1 percent
- Total Qualified Leads: 17 leads
- Effective Cost-Per-Lead: $588.23
Scenario B: The Performance-Engineered Site
- Average Cost-Per-Click: $4.00
- Total Ad Clicks: 2,500 visitors
- Mobile Page Load Time: 1.1 seconds
- Immediate Bounce Rate: 24 percent
- Retained Visitors Evaluating the Offer: 1,900 visitors
- On-Page Conversion Rate: 4.8 percent
- Total Qualified Leads: 91 leads
- Effective Cost-Per-Lead: $109.89
Both businesses spent the exact same $10,000 media budget with identical ad targeting. The performance-engineered site generated more than five times as many qualified customer conversations simply because visitors were able to see and interact with the page.
The Ad Auction Penalty: Quality Scores and Rising CPCs
Page latency damages paid advertising campaigns in a second, more insidious way: it inflates your cost-per-click within the advertising auction itself.
Google Ads determines ad positioning and click costs using Ad Rank, calculated by multiplying your maximum bid by your Quality Score. Quality Score is graded on a scale from 1 to 10 and depends on three components:
- Expected click-through rate
- Ad relevance
- Landing page experience
Google evaluates landing page experience by measuring crawl latency, mobile responsiveness, and post-click bounce signals. When automated crawlers encounter high Time-to-First-Byte (TTFB) or heavy JavaScript payloads that delay interaction, Google assigns a below-average rating to the landing page experience.
The penalty is direct financial inflation:
- An ad group with a Quality Score of 8 to 10 receives a discount of up to 50 percent on the auction bid price required to secure top ad positions.
- An ad group with a Quality Score of 3 to 4 faces a bid tax of 25 to 40 percent to maintain that same ranking.
A company operating a slow landing page pays higher rates for every single ad click than a competitor with clean web architecture. Over a twelve-month campaign, this speed penalty consumes tens of thousands of dollars in wasted media spend.
Meta Ads applies comparable penalties. When users click an Instagram or Facebook ad and bounce back within two seconds because the page failed to render, Meta algorithms interpret the destination as a low-quality user experience. The ad auction throttles distribution, increases CPMs (cost per thousand impressions), and prioritizes competing advertisers with faster landing destinations.
Search Engine Reality: Core Web Vitals in Production
For organic search visibility, Google transitioned speed from a secondary guideline into an algorithmic ranking standard through Core Web Vitals.
Search crawlers evaluate three core metrics to determine page performance:
1. Largest Contentful Paint (LCP)
LCP measures the time required for the largest visual element in the viewport (typically a hero banner, headline block, or featured product visual) to render fully. Google classifies an LCP under 2.5 seconds as good. Pages with an LCP exceeding 4.0 seconds receive poor performance marks and lose ranking priority against faster competitors in mobile search results.
2. Interaction to Next Paint (INP)
INP tracks the latency of user interactions across the entire lifecycle of a visit. When a user taps a navigation menu, expands a dropdown filter, or clicks a submission button, INP measures the delay before the browser updates the visual frame. A score under 200 milliseconds is required. Heavy JavaScript execution loops that lock the browser main thread cause delayed clicks and high INP penalties.
3. Cumulative Layout Shift (CLS)
CLS measures visual stability. It calculates unexpected layout movement while elements load asynchronously. When fonts swap sizes abruptly, images load without specified aspect ratios, or dynamic ad banners push body copy downward, visitors accidentally misclick links. Google requires a CLS score below 0.1.
When a website consistently fails Core Web Vitals assessments across mobile users, organic rankings decline for competitive commercial keywords, shifting organic search traffic directly to competitors.
Comparison: Slow Template Sites vs. Performance-Engineered Systems
| Operational Dimension | Standard Bloated Template Site | Performance-Engineered Custom Architecture |
|---|---|---|
| Median Mobile Load Time | 5.0 to 8.5 seconds | 0.8 to 1.4 seconds |
| Time to First Byte (TTFB) | 600ms to 1,500ms (database-bound) | 40ms to 90ms (cached at edge locations) |
| Core Web Vitals Pass Rate | Fails LCP (>3.5s) and INP (>350ms) | Passes all metrics (LCP <1.2s, INP <60ms) |
| Average Mobile Bounce Rate | 60 percent to 75 percent | 20 percent to 32 percent |
| Google Ads Quality Score Impact | Below average; 20% to 40% bid penalty | Above average; up to 30% bid discount |
| Total DOM Nodes | 2,500 to 4,500 nodes | 400 to 800 nodes |
| Third-Party Script Execution | Unrestricted inline scripts blocking render | Isolated, deferred, or edge-proxied tags |
Anatomy of the Speed Penalty: What Bloats Modern Websites
Most slow websites were not built with bad intentions. They become slow incrementally through accumulated technical bloat. Four primary structural bottlenecks create the speed penalty:
1. Uncompressed and Unsized Media Payloads
The single most frequent source of page weight is unoptimized media. High-resolution product images, background banners, and hero graphics are frequently uploaded as 3MB PNG or JPEG files straight from graphic design tools.
A single 3MB hero image downloaded over a standard mobile 4G connection takes three to four seconds to transfer. If the image lacks width and height attributes in the markup, the browser cannot calculate layout dimensions in advance, causing severe Cumulative Layout Shift once the file renders.
2. Third-Party Script Congestion
Marketing stacks frequently accumulate tracking scripts without oversight:
- Google Tag Manager
- Meta Pixel
- LinkedIn Insight Tag
- Hotjar or Clarity session recording tools
- Intercom or Zendesk live chat widgets
- Conversion rate optimization A/B test scripts
- Cookie consent management banners
Each script injects external JavaScript libraries that compete for the browser's single execution thread. A live chat widget can easily add 800KB of parsed JavaScript, delaying page interactivity by several seconds while the script downloads and executes.
3. DOM Bloat in Visual Page Builders
Visual drag-and-drop website builders allow non-engineers to construct web layouts quickly, but the underlying code output is deeply nested and inefficient.
A simple two-column layout built in a drag-and-drop editor often wraps text in seven layers of nested container divisions, generating thousands of DOM nodes. When mobile browsers parse thousands of redundant elements, the device processor experiences layout recalculation delays that directly inflate INP and LCP metrics.
4. Uncached Database Queries on Every Page Request
Many monolithic content management systems execute dynamic SQL queries against a central database every time an anonymous user loads a marketing landing page.
If the server handles simultaneous traffic spikes from an active ad campaign, the database connection pool saturates. Time-to-First-Byte balloons from 200 milliseconds to two seconds, forcing mobile visitors to stare at a blank white screen while the server compiles HTML from scratch.
How Modern Engineering Eliminates the Speed Penalty
Fixing website performance does not require sacrificing design beauty or eliminating analytics. It requires replacing fragile, monolithic delivery pipelines with modern web architecture.
Professional engineering teams apply four architectural principles to maintain sub-second page speeds:
1. Edge Caching and Static Pre-Rendering
Marketing pages, product catalog listings, and landing pages rarely change from minute to minute. Modern web applications pre-render static HTML and CSS during the deployment build process and distribute those files across global edge networks.
When a prospect clicks an ad in London, New York, or Mumbai, the request is served from a regional edge server within 30 miles of their device. Time to First Byte drops below 80 milliseconds because the server does not execute database queries to fulfill the request.
2. Next-Generation Asset Pipelines
Production asset pipelines process all images through automated build workflows:
- Converting high-resolution sources into modern WebP and AVIF formats, reducing file weight by 60 to 80 percent without visual degradation.
- Generating responsive source sets so mobile phones download 400-pixel width images while 4K desktop screens receive high-resolution files.
- Inlining explicit height and width dimensions to eliminate layout shifts.
- Preloading critical hero images in the document header while lazy-loading below-the-fold media.
3. Script Isolation and Main-Thread Hygiene
Tracking scripts and analytics must not block the critical rendering path.
Engineering teams isolate third-party trackers by executing them via web workers off the primary browser thread, or by proxying analytics events server-side through a single lightweight endpoint. Heavy interactive elements (such as customer support chat widgets) remain unmounted until a user explicitly clicks a contact trigger, saving hundreds of kilobytes of initial script evaluation.
4. Clean, Semantic Document Architecture
Custom web development replaces thousands of bloated template containers with concise, semantic HTML markup and utility CSS. Reducing DOM depth from 3,500 nodes to 500 nodes allows low-power mobile devices to render layouts instantly, keeping Interaction to Next Paint well below the 200-millisecond threshold.
Step-by-Step Performance Audit Checklist for Business Operators
If you suspect page latency is harming your ad performance or search rankings, run through this four-step diagnostic review:
Step 1: Run Mobile-Throttled Performance Audits
Do not test your website on a fiber-optic desktop connection. Open Google PageSpeed Insights and WebPageTest, set the testing profile to a mid-tier mobile device over a 4G connection, and audit your core conversion pages.
Verify that your mobile performance score exceeds 90, Largest Contentful Paint stays below 2.0 seconds, and Cumulative Layout Shift measures below 0.05.
Step 2: Conduct a Third-Party Tag Audit
Open browser developer tools and inspect the network tab during a hard page reload. Sort resources by transfer size and execution time.
Identify every tracking tag, analytics snippet, and plugin currently firing. Decommission unused legacy pixels from old marketing experiments, and ensure necessary scripts load with asynchronous or deferred attributes.
Step 3: Enforce Media Compression Standards
Scan your landing pages for image assets exceeding 150KB. Replace oversized PNG files with optimized WebP or AVIF formats. Confirm that every image tag includes width and height attributes to safeguard your CLS score.
Step 4: Measure Time to First Byte (TTFB)
Check your server response time across multiple geographic regions. If TTFB exceeds 300 milliseconds on static landing pages, configure edge caching rules through a content delivery network or migrate landing infrastructure to a modern decoupled framework.
Frequently Asked Questions
What is a good page load time for a business website?
For modern commercial websites, a mobile page load time under 1.8 seconds is recommended. Pages supporting paid advertising traffic should achieve an interactive state within 1.2 to 1.5 seconds. Once load time exceeds 2.5 seconds, bounce rates escalate sharply.
Why does my website load quickly on my phone but score poorly on Google PageSpeed Insights?
Personal testing uses cached assets, high-speed Wi-Fi, and high-end mobile hardware. Google evaluates performance using simulated mid-tier mobile devices running on throttled 4G network connections without prior asset caching. PageSpeed Insights reflects what a first-time visitor experiencing real-world mobile network congestion encounters.
Can plugins fix a slow WordPress or Shopify site?
Performance plugins can assist with basic tasks like image compression and script minification. However, stacking multiple optimization plugins often introduces script conflicts and database overhead. If the underlying theme suffers from structural DOM bloat or server-side database bottlenecks, plugins cannot overcome architectural limitations.
How does page speed impact Google Ads Cost-Per-Click?
Google Ads factors landing page experience into Quality Score. When slow load times cause high bounce rates and poor mobile evaluations, Quality Scores fall into the 3 to 5 range. Lower Quality Scores require higher monetary bids to secure top ad placements, increasing your cost-per-click by 20 to 40 percent.
How does an engineering partner like Webifyit improve website performance?
Webifyit engineers custom, high-speed web applications, high-converting landing architectures, and scalable backend platforms. We eliminate template bloat, implement sub-100ms edge delivery, and optimize Core Web Vitals so companies maximize paid ad conversions and achieve durable search engine visibility.
The Engineering Takeaway
Speed is not a cosmetic feature or a developer preference. Speed is the foundation of user conversion, marketing efficiency, and organic discoverability.
Spending thousands of dollars driving high-intent ad traffic to a web page that stalls for four seconds is equivalent to locking the front doors of a retail store during business hours.
By replacing bloated visual templates with disciplined frontend architecture, modern asset pipelines, and edge-cached delivery, organizations protect their marketing investments and deliver the responsive experience modern customers expect.
Ready to eliminate the speed penalty and turn traffic into qualified customers?
Webifyit engineers high-performance web applications, fast landing architectures, and dependable software systems for growing businesses and digital agencies.
Explore Web Performance Engineering with Webifyit
Published by Atharv K. | Webifyit